What's new in Constellation v3.0
Here is a (sizeable) list of changes we’ve added to this version of Constellation.
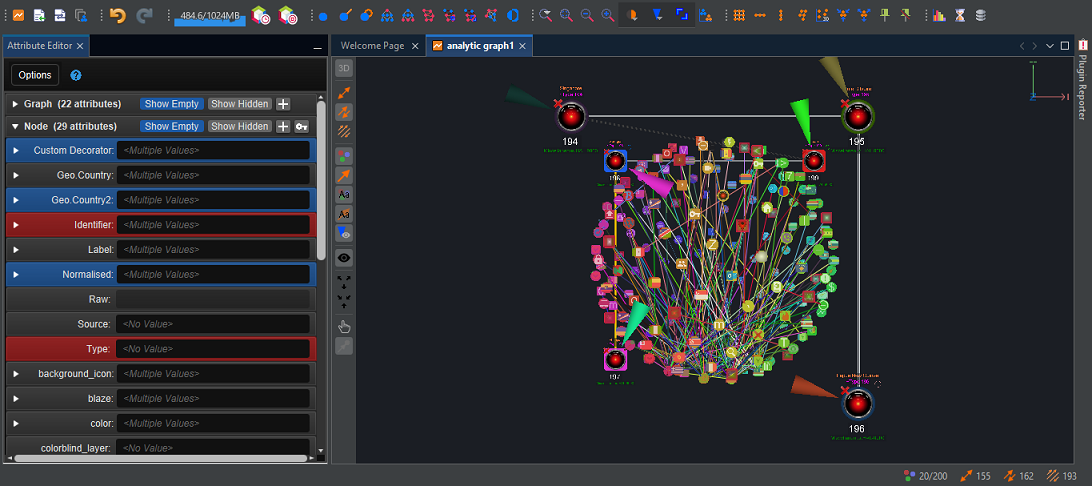
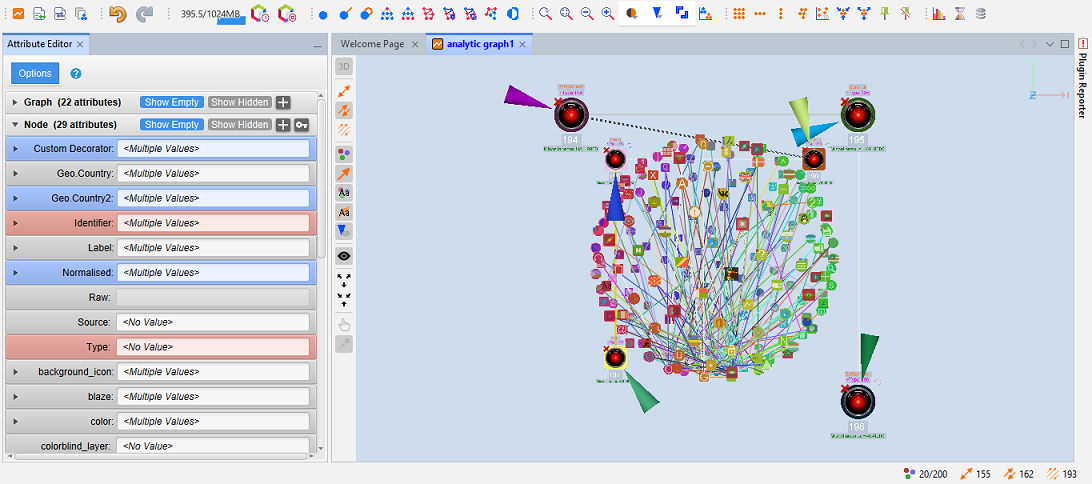
All-New Dark and Light Modes + New Menu Icons
One of the visual standout features added that you will notice as soon as you load the application is the new dark and light modes. For a long time, Constellation has had a mixture of both light and dark color schemes scattered throughout the application. With the release of v3 though, we’ve now consolidated those schemes into separate light and dark feels. Alongside that, the icons used in menu options throughout the application have also been updated to ensure visibility in either mode.
By default, Constellation will run in dark mode. This can be changed though via the Options Menu. Simply go to Setup -> Options -> Appearance -> Look and Feel and choose your preferred look and feel. Any look and feel with “Dark” in the name will load with the dark scheme, and all others will load with the light scheme. We personally recommend using either FlatLaf Dark (the default) or FlatLaf Light (if you prefer light mode) as these were the look and feels used when putting together the color schemes, but feel free to use any of the options available.
One thing to keep in mind is that for graphs themselves, the mode your application is in will only affect the graph’s background color when creating a new graph. New graphs created in dark mode will have the classic Night Sky color, but graphs created in light mode will have the new Light Sky color. Opening existing graphs in either mode will retain the background color that the graph previously had. Note that the background color is a graph attribute and so if you wish to change the background color of your graph, you can do so by editing the background_color attribute via the Attribute Editor.
Colorblind Overlays for your Graph
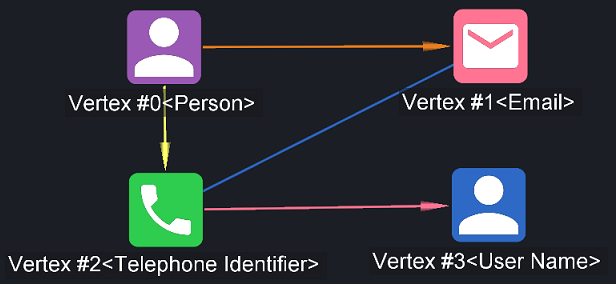
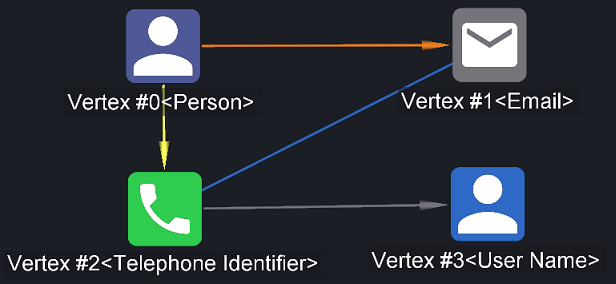
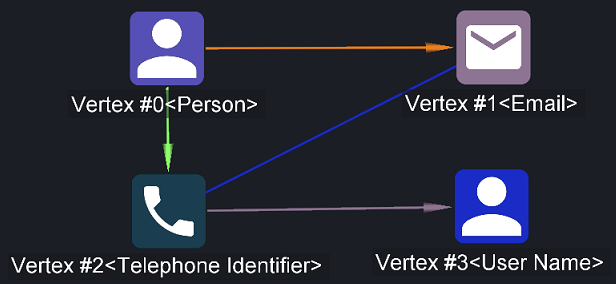
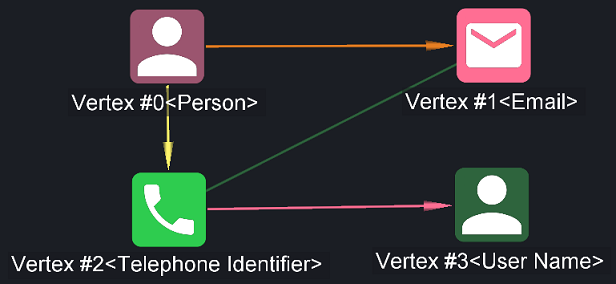
Another big addition to v3 is a big one for accessibility. Previously, Constellation development hasn’t put much consideration into whether the color schemes being used are colorblind-friendly. For v3 though, this is no longer an oversight as we’ve now introduced the option to apply colorblind-friendly overlays to your graph.
Choose a colorblind mode to apply to your graph by navigating to Setup -> Options -> CONSTELLATION -> Application -> Colorblind Mode. Current options include None (i.e. no filter applied, the default), Deuteranopia, Protanopia, and Tritanopia. After choosing, when you next Complete with Schema, your graph will be colored according to the colorblind mode chosen to ensure that the colors on your graph are compliant with the mode selected.
For modes other than None, a new attribute will be added (if it doesn’t already exist) to your nodes and transactions called “colorblind_layer” whose value will either match the value in the color attribute (if the color is compliant), or a newly calculated color (if the color was not compliant). The value in the new attribute is then what you will see on the graph.
|
|
|
|
Brand New Word Cloud View
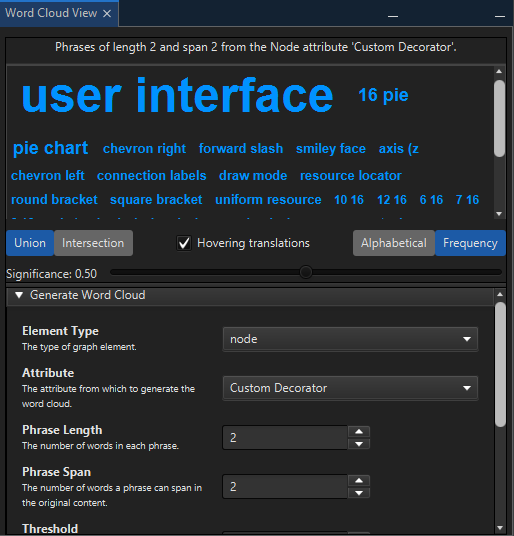
The newest view available for use in Constellation is the Word Cloud View. Available via the Experimental menu (or Ctrl-Shift-W if you like keyboard shortcuts), the Word Cloud View allows you to generate a word cloud based on a string attribute on your graph. This then enables you to analyse the phrases that appear on your graph and how often those phrases appear.
Word Clouds can be generated based on phrase length, phrase span, and a threshold for the minimum number of times a phrase is found. You can also filter the cloud based on a user-supplied text file of phrases you wish to filter on.
Export your Graphs to SVG
Constellation for a long time has had the ability to save a screenshot of your graph as a PNG file. This has enabled users to embed their (non-interactive) graph into word documents, presentations, and other places to view a graph without needing to load Constellation. A limitation of it though, is that the file type isn’t scalable, meaning attempts to blow up the image can make it pixelated and hard to look at. To help with that issue, we’ve introduced exporting to an SVG file (available from File -> Export -> To SVG...).
For those who aren’t aware, SVG’s are vector images, which in simple terms means that the image will maintain its clarity when being blown up. This means being able to include much clearer images in presentations or anywhere you want to include a view of your graph. Unlike the Screenshot export, the SVG export also gives you more flexibility in choosing which angle to export the graph from (not just the current camera angle), and even which parts of graph get exported.
One caveat to be aware of with the functionality though, is that it is a memory-intensive operation. Because of that, it is recommended that you only use the feature for exporting smaller graphs (it's been noted in environments it was tested in, that the feature encounters memory issues once getting past 50,000 nodes, 50,000 transactions).
Conversation View Update
A big change to the interface in the Conversation View now sees conversations paginated in a similar way to what is done in the Table View. By doing this, we’re hoping this helps make the view more performant by reducing the strain on the graphics trying to load all the conversation bubbles. Like the Table View, you have the option to choose how many conversations bubbles you want displayed on each page: 50, 100, 250, or 1000.
Constellation Client Fixed
Last release, we made our first update to the Python client in a long time. What we discovered out of that though, is that it turns out the client hasn’t really been working as intended for quite some time. The primary reason for this was the .ipython folder (where the client is installed) was no longer by default added to the classpath, which means that users could no longer simply call the client from any folder they so wished. Other issues with the client also surfaced including compatibility with newer Python versions. With all of that to consider, changes had to be made to the client for it get back to functioning as intended.
So for v3, we’ve updated the way that the client is installed. Instead of downloading the client, Constellation now performs a pip install of the client (Note that it is installing a local instance rather than from PyPI). Specifically, it will run a pip install --update, that way you can get the latest changes for the client every time. This will run whenever you launch either Start Jupyter Notebook or Start REST Server (in case you prefer to launch your notebook application separately).
Changes have also been made alongside it to enable compatibility with later versions of Python while also maintaining compatibility with older versions.
Keyboard Shortcuts for Zoom In and Out
Constellation has always allowed zooming in and out of a graph using the scroll wheel of your mouse. For those that don’t have access to that though, Constellation now has keyboard shortcuts for these actions. Ctrl- - (including Num Pad) will zoom out and Ctrl- = (and Ctrl- + on Num Pad) will zoom in on your graph.
Reset Data Access View Category Preferences
Over the last couple versions of Constellation, we’ve introduced customisation around which categories of plugins you see (and in which order you see them) in the Data Access View. For v3, we’ve extended this further by adding a reset option. In the preferences menu (Setup -> Options -> CONSTELLATION -> Data Access View), when you click on “Restore to Default”, all the categories will be placed in their default visibility and ordering.
Select All Nodes or Transactions
Have you ever wanted a quick way to select all the nodes or all the transactions on your graph, without having to select everything (or manually selecting)? The Selection menu now comes with two new options. “Select Nodes” selects (only) all the nodes, and “Select Transactions” does a similar thing for transactions. These are the inverse operations of the existing “Deselect Nodes” and “Deselect Transactions”.
Attribute Editor Update
A minor update has been made to the Attribute Editor in order improve the experience around editing values for attributes. Previously, if a graph element had no value for an attribute and you wished to edit the value, you would first have to untick the “No Value” checkbox before proceeding to alter the value. Assuming though that you intend to edit the value when you bring up the edit dialog, unticking the checkbox presents as an extra step you would rather not have to do or even think about.
For v3, we’ve removed this step so that the No Value checkbox is always unticked when you enter the edit dialog. This allows you to get straight into editing the value as desired. If you wish the set the value to No Value, the checkbox is still there for you to check. If you wish to retain the No Value you had, you can simply close the dialog box (or press Cancel).
Find View Update
The Find View has a new feature which enables you to zoom to your search results. By ticking the “Zoom to Selection” checkbox, when you go through your results (e.g. with Find All or Find Next/Previous), Constellation will put the results in focus in the Graph window. If you’re someone who has gotten frustrated at not being able to find where all the search results are on your graph, this is the feature for you.
Layers View Update
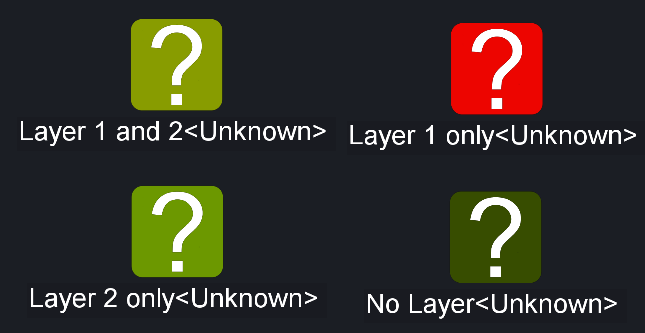
The Layers View has received an update to the logic for determining what is visible on the graph according to the layers selected. Previously, the logic was a little messy and differed depending on whether the graph elements in the selected layers were determined by query or by manual addition. This in turn led to a lot of confusion surrounding what you expected to see when you had multiple layers selected. To fix this, the logic has been cleaned up and put in your hands to determine by introducing two modes: Union and Intersection.
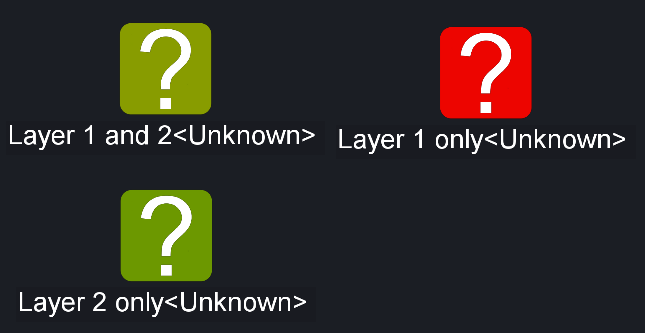
When multiple layers are selected in Union Mode, any graph element that belongs to any of the selected layers will be visible. For example, if layer 1 contains nodes 1 and 2, and layer 2 contains nodes 2 and 3, then having layers 1 and 2 selected would see all of nodes 1, 2, and 3 visible.
When multiple layers are selected in Intersection Mode, only graph elements that belong to all the selected layers will be visible. For example, if layer 1 contains nodes 1 and 2, and layer 2 contains nodes 2 and 3, then having layers 1 and 2 selected would see only node 2 visible.
|
|
|
|
Image Graph Builder Update
For those who used the Image Graph Builder before (Experimental -> Build Graph -> From Image...), you now have the option to import multiple images at the same time. When doing so, you have the option to either have each image overlayed on top of each other or presented side-by-side. You also have the option to have each image presented in its own layer in the Layers View.
Several Bug Fixes
Numerous bug fixes have also been made. The number of bug fixes that have occurred is quite extensive so we won’t list them all here, but include fixes made to the Conversation View, Find View, Layers View, Notes View, Datetime pickers, and Help Pages. We hope that each of the fixes makes your Constellation experience a better one.
Want to know more?
You can find out more information about the latest updates on the What's new page once you have installed version 3.0. There's loads of extra details available in the Release Notes and Change Log.
Would you like to learn more about how Constellation works?
There is a training package available on GitHub to learn how to make the most use of the various features in Constellation. There is also developer training for those seeking to deep dive into the underlying source code.
Contact Us
Do you have any feedback or suggestions for improvement? Noticed a bug? You can log an issue via the Help menu or clicking here.